Project Showcase
Highlight of my featured works
Automating Health Claim Reports
Built during my Enrichment Program internship as a Data Analyst in the Health Claims unit at PT Asuransi Astra Buana. The monthly corporate health claim report used to be assembled by hand in Excel every cycle. I rebuilt it as a single refreshable Power BI model end to end: I write the SQL to pull the claim records straight from the database, Power Query handles the cleaning and provider-name standardisation, DAX handles every comparison and ranking, and the report regenerates itself on refresh instead of being rebuilt from scratch each month.
Note: all screenshots are intentionally blurred on provider names and monetary values. The underlying data is confidential client data, so only the report structure and the measure logic are shown.
⚙️ What I Built
- SQL queries that pull the claim records from the database — joining claim, member, provider and diagnosis tables, filtering by treatment and settled dates, and aggregating before the data ever reaches Power BI
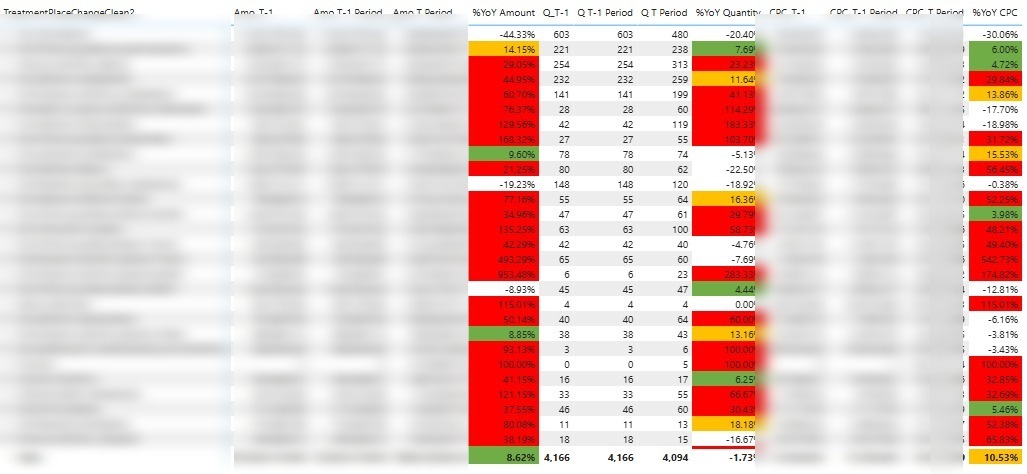
- Provider-level matrix comparing Amount, Quantity and CPC against the same period last year, with red/amber/green rules driven by DAX
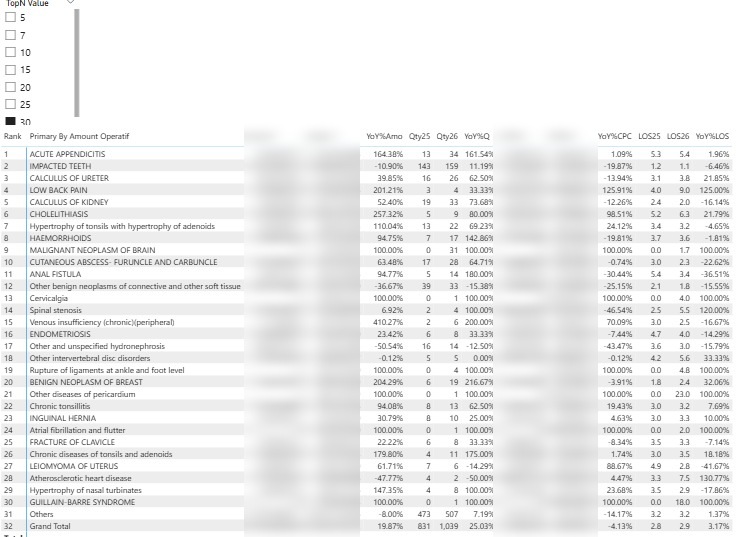
- Dynamic Top-N diagnosis ranking (5–30) that keeps an accurate "Others" row and Grand Total at any N
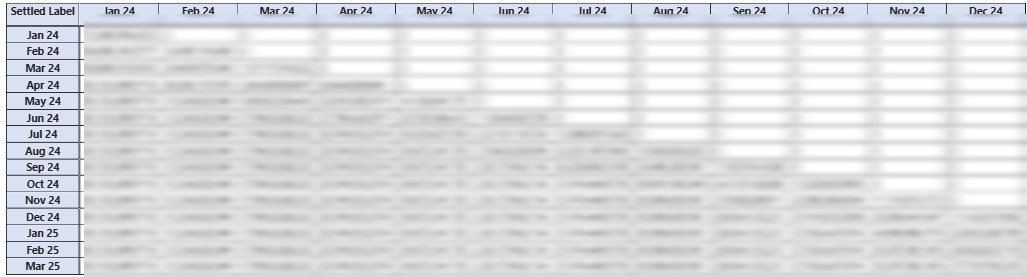
- Claim triangulation matrix (Settled Month vs Treatment Finish Month) to expose the run-off pattern
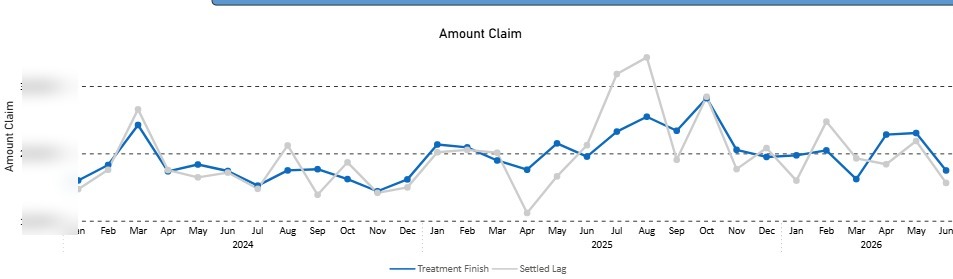
- Trend chart separating Treatment Finish from Settled Lag to size the reporting delay
- Disconnected "Kolom Summary" table so column headers and measures switch from one slicer
🛠 Tech Stack
- SQL — joins, date filtering and aggregation to extract claim data from the database
- Power BI Desktop & Power BI Service
- DAX — time intelligence, RANKX, dynamic measure switching
- Power Query (M) — ETL, cleaning, provider name standardisation
- Excel for supporting mapping tables
📌 Impact
The report went from a manual Excel rebuild every cycle to a one-click refresh, which cut the preparation time dramatically and removed the copy-paste errors that came with it. More importantly it changed what the team could ask: because CPC, quantity and amount now move together on the same page, the unit can tell whether a cost increase came from more claims or from more expensive claims, and whether it sits with a particular provider or a particular diagnosis. The triangulation matrix also made settlement lag visible for the first time, which matters when you are reading a month that is not fully developed yet.
🎯 What I Learned
The hard part was never the visuals — it was making the measures behave correctly when the user changes the filter context. Getting Top-N, "Others" and Grand Total to stay consistent, and getting period comparisons to hold up against incomplete months, taught me far more about filter context and evaluation order than any tutorial did. I also learned how much of analytics work is actually data cleaning: standardising provider names alone decided whether the whole YoY comparison was trustworthy. Writing the extraction in SQL rather than pulling raw tables taught me to push filtering and aggregation as far upstream as possible — the model got noticeably lighter and refreshes faster once the heavy work happened in the query.