Project Showcase
Highlight of my featured works
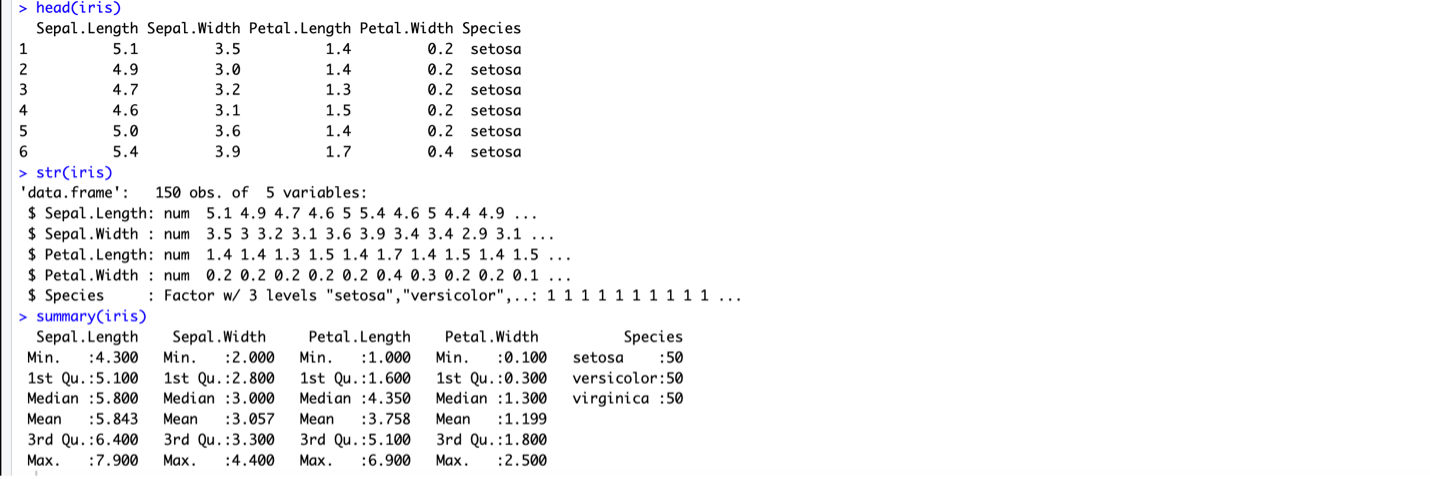
Iris Dataset Visualization
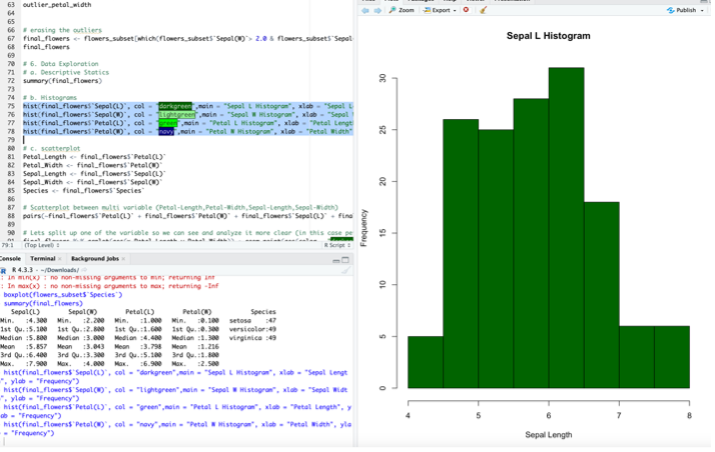
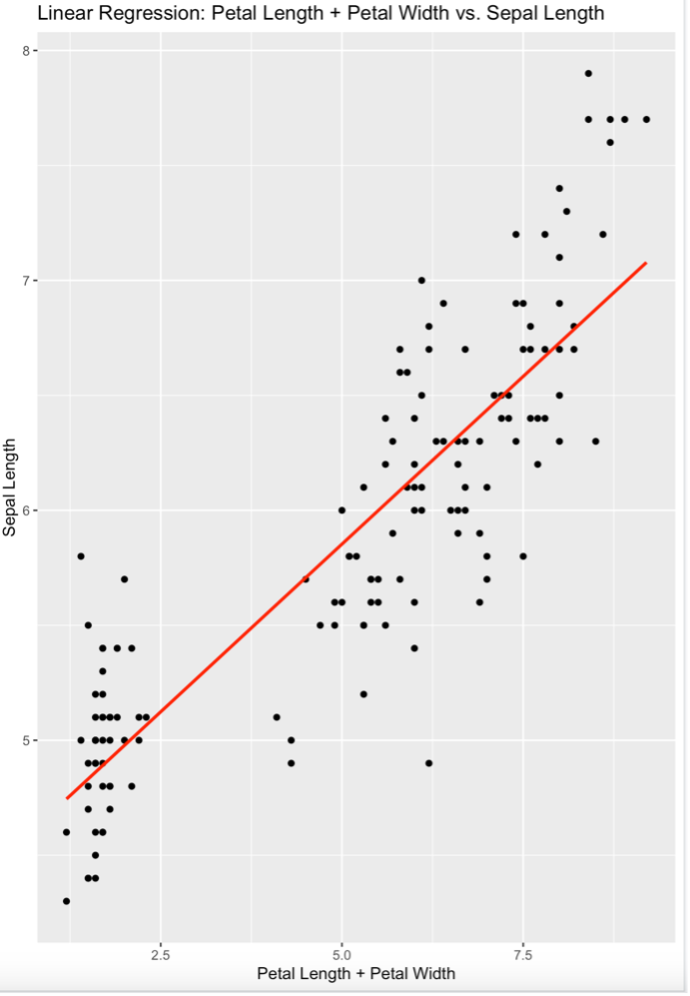
A comprehensive Iris dataset analysis in R. Includes cleaning, outlier removal, histograms, scatterplots, regression, correlation analysis, and hypothesis testing.
🎯 What I Learned
- Cleaned and normalized the Iris dataset
- Detected and removed outliers
- Built visualizations with ggplot2
- Performed correlation, regression, and hypothesis testing
🛠 Tech Stack
- R, dplyr, ggplot2
- datasets (Iris)
📌 Evaluation / Next Step
The analysis confirmed expected relationships within the Iris dataset. Visualizations clearly separate Setosa from Virginica/Versicolor, and regression showed linear trends between Petal and Sepal. Next steps include applying this workflow to more complex datasets, adding clustering, or exploring classification models.