Project Showcase
Highlight of my featured works
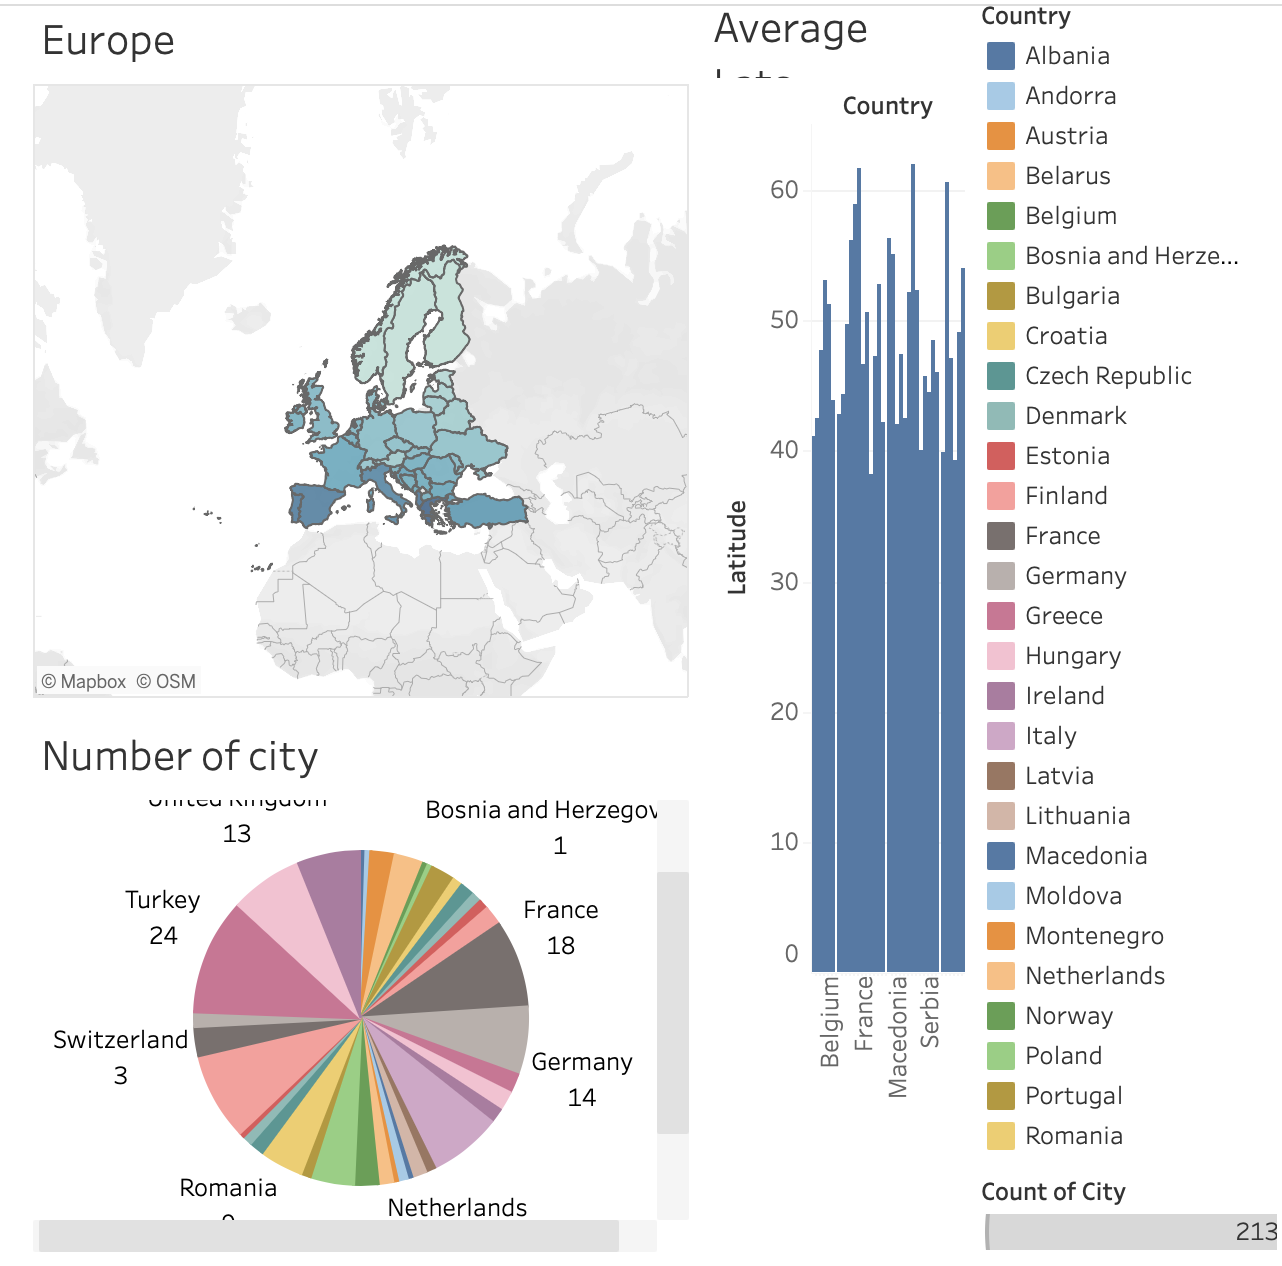
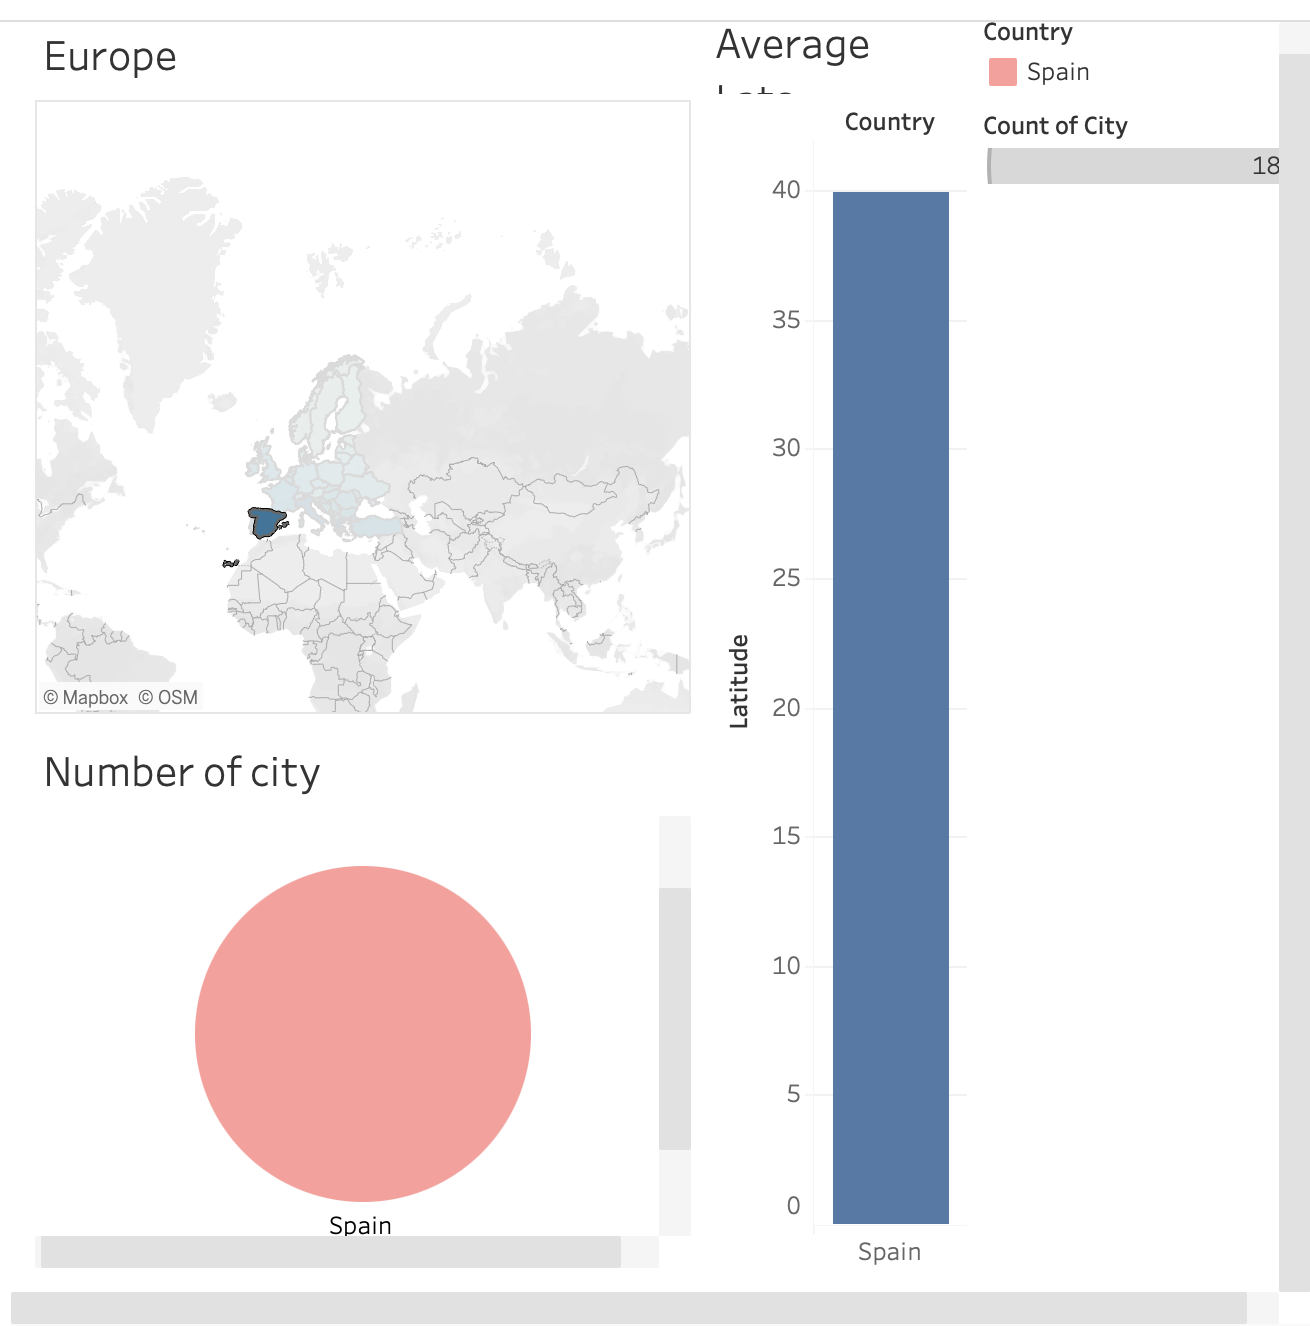
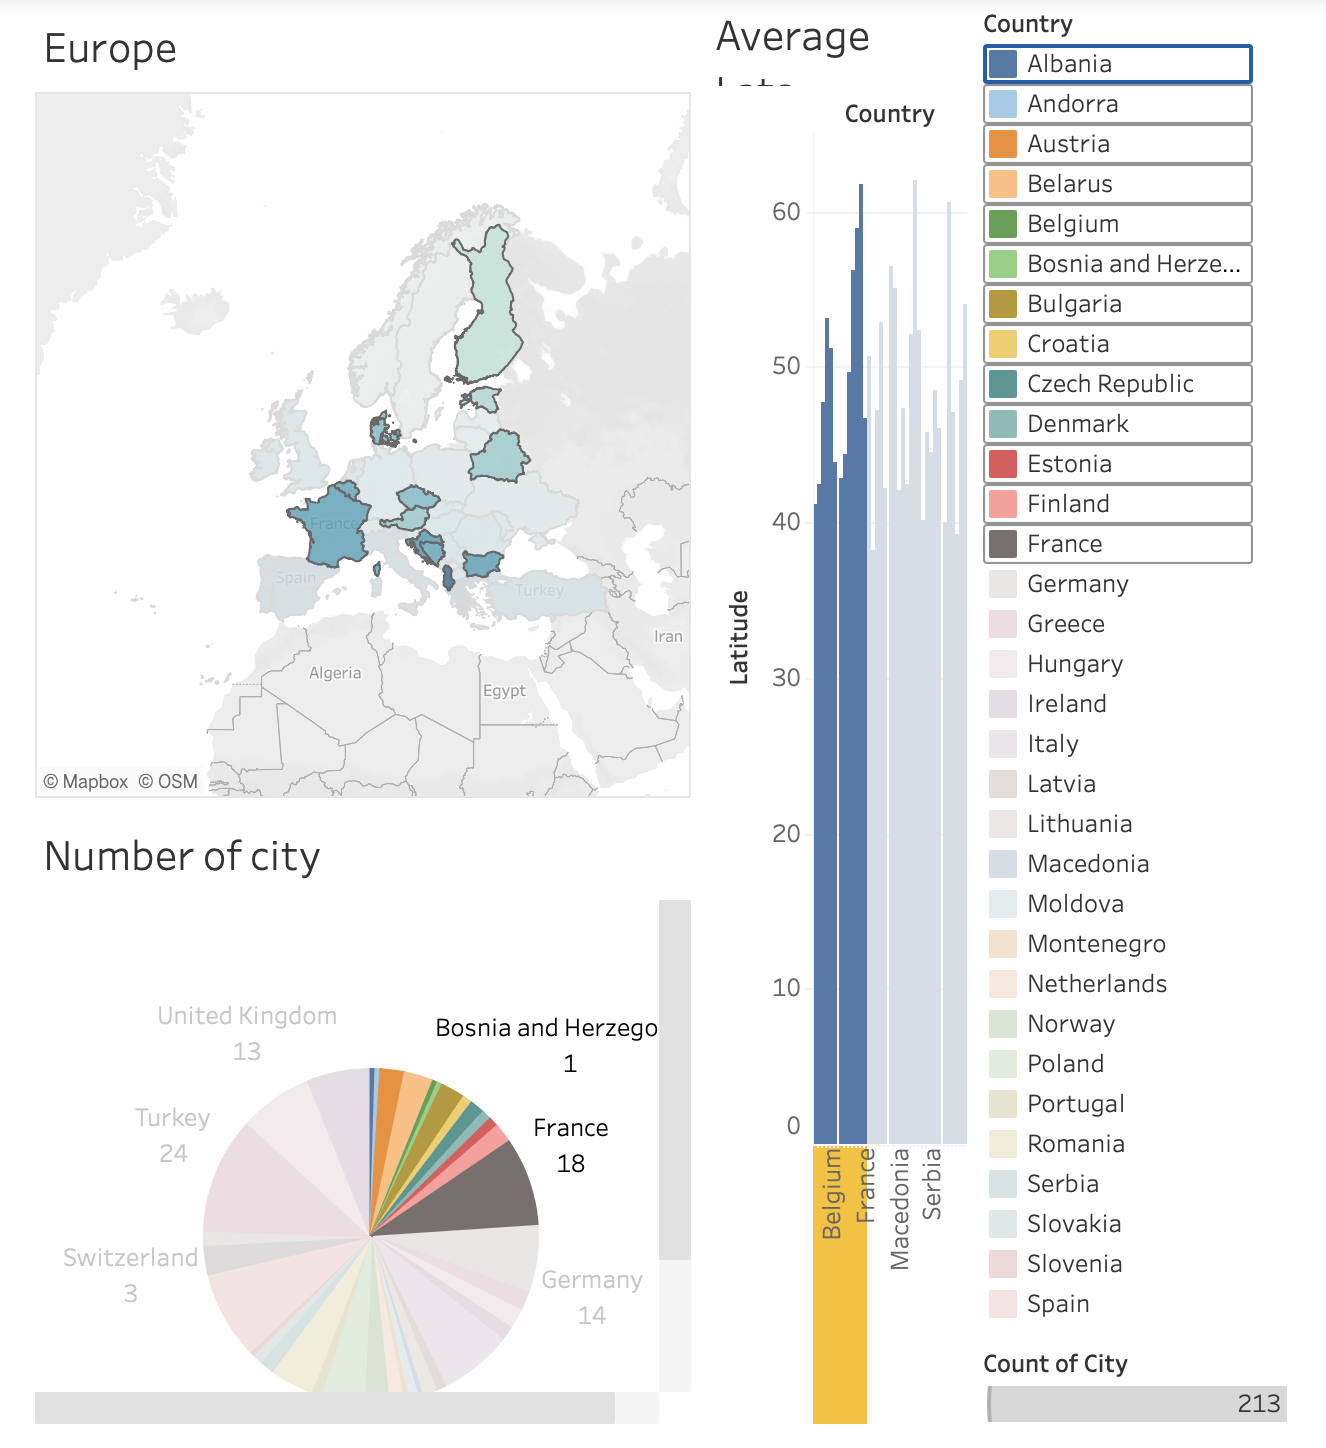
European City Analysis
A Tableau dashboard analyzing European cities. Includes geographic distribution on maps, average latitude by country, and pie charts showing city counts per country.
🎯 What I Learned
- Built multi-view dashboards with maps, bar charts, and pie charts
- Analyzed geographic spread of cities by country
- Interpreted disparities in city counts across countries
🛠 Tech Stack
- Tableau
- Excel / CSV Dataset
📌 Evaluation
The dashboard highlights unequal city representation across countries. While larger countries like Turkey and France dominate city counts, smaller nations contribute far fewer cities. Average latitude comparisons provide additional spatial insights. Future iterations could integrate demographic or economic data to enrich the context.